Purpose
This graphic displays the empiric (from observations) and theoretical (from simulations) survival function and average number of events for time to event data. It is only available for outputs of type event.
Example of graphic
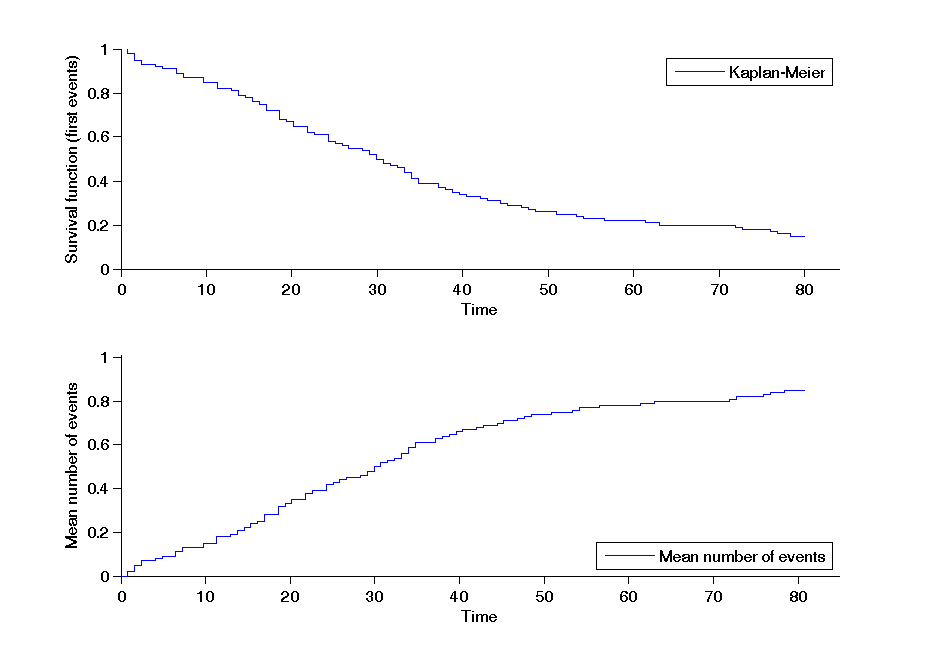
In the following example, the parameter Te of a event model with a constant hazard function (=1/Te) is estimated. The figure presents the Kaplan-Meier plot w.r.t. the time (top) and the mean number of events (bottom).
Settings
- Selection:Kaplan-Meier plot which represent the survival function.
- mean number of events
- Display
- Empirical
- Predicted median
- Prediction interval
- Censored data
- Accuracy
- Legend
- prediction distribution
- Level
- Number of bands
By default, the empirical of the survival function and of the mean number of events is displayed.