Purpose
This graphic displays the prediction distribution. It allows to compare the observations with the theoretical distribution of the predictions.
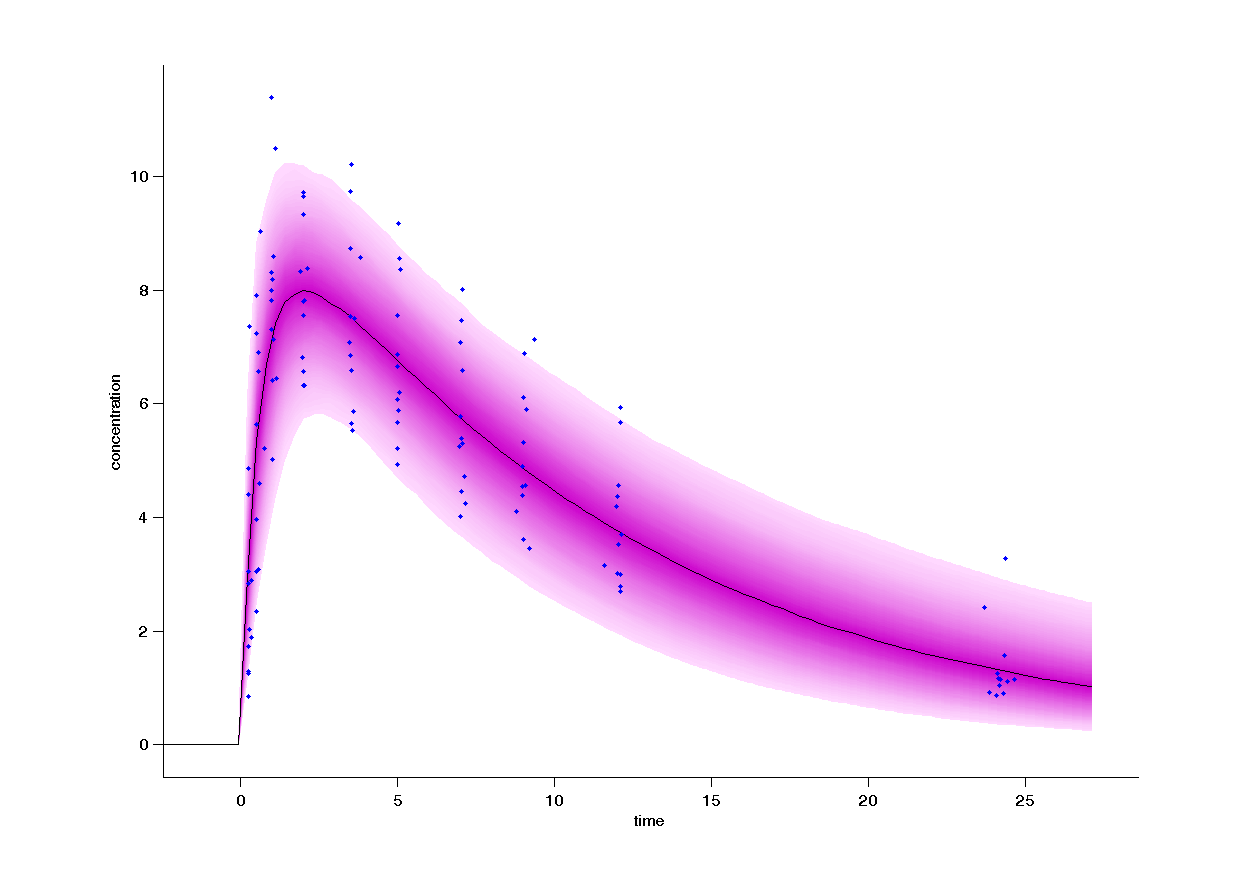
Example of graphic
In the following example, the parameters of a one compartmental model with first order absorption and linear elimination (on the theophylline data set) are estimated. One can see the prediction distribution of the concentration along with the data set.
Settings
- Display
- Observed data
- Median
- Continuous or discrete representation of the distribution
- Level (meaning that the distribution corresponds to
)
- Number of band and the associated percentile in case of a discrete representation
- Legend
![[50-\frac{level}{2}, 50+\frac{level}{2}]](http://s0.wp.com/latex.php?latex=%5B50-%5Cfrac%7Blevel%7D%7B2%7D%2C+50%2B%5Cfrac%7Blevel%7D%7B2%7D%5D&bg=ffffff&fg=000&s=0 "[50-\frac{level}{2}, 50+\frac{level}{2}]") )
)By default, only the prediction distribution and the median are displayed.