Purpose
This graphic displays the convergence of the estimated parameters with respect to the iteration number.
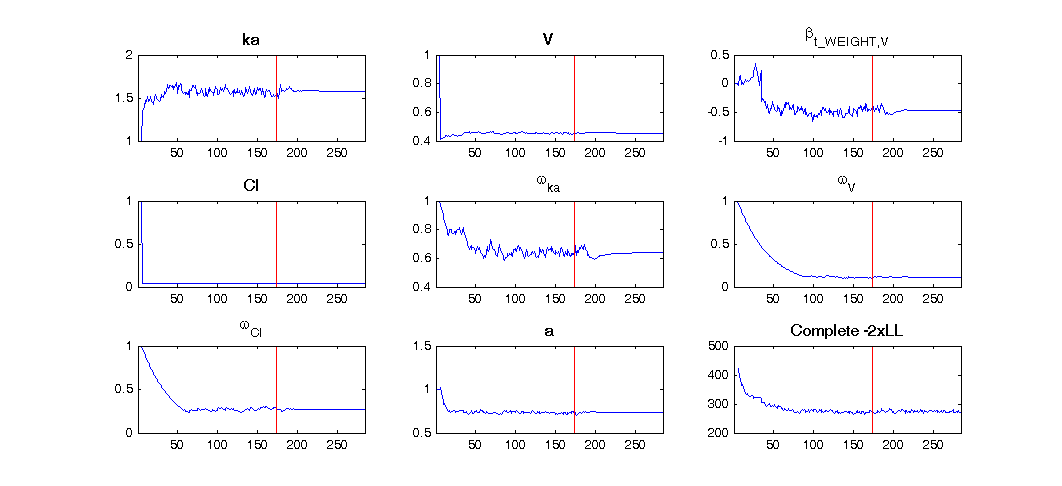
Example of graphic
In the following example, the parameters of a one compartmental model with first order absorption and linear elimination (on the theophylline data set) are estimated. One can see for distribution of the random effects associated to each parameter.
Settings
- Display: number of graphics the user want to see at the same time. It is convenient when there are a lot of parameters. Indeed, using this setting, the user can focus on particular parameter convergence for example.
By default, all parameters are displayed.