Purpose
The figure displays the individual fits, using the population parameters with the individual covariates (red) and the individual parameters (green) on a continuous grid. This is a good way to see on each subject the validity of the model, and the actual fit proposed. It is possible to show the computed individual parameters on the figure. Moreover, it is also possible to display the median and a confidence interval for (
Example of graphic
In the proposed example, the concentration for the warfarin data set is presented. For each subject, the data are displayed with blue crosses along with the individual fit and population fit (the prediction using the estimated individual and population parameters respectively). 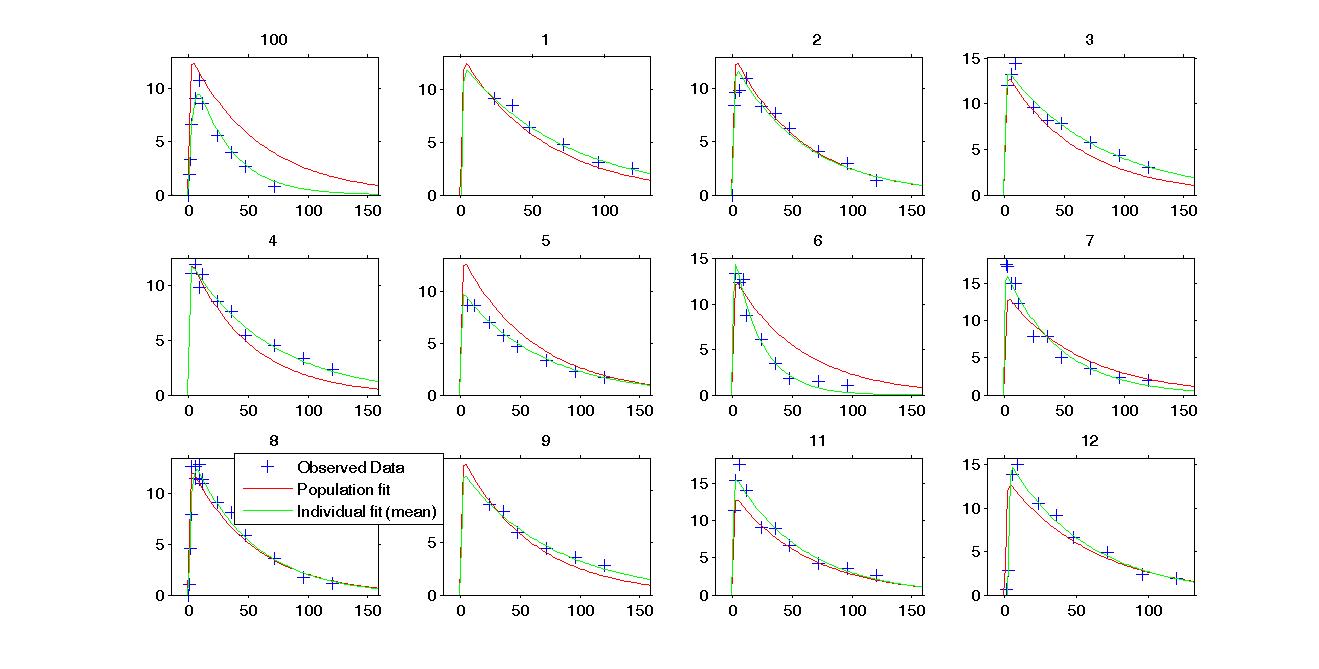
Settings
- Grid arrange. Define the number of subjects that are displayed. The user can define the number of rows and the number of columns. Moreover, a slider is present to be able to change the subjects under consideration.
- Display
- Filter : filter the observations when stratify.
- Split occasions: Split the individual by occasions in case of IOV.
- Population fits : Model estimation on the subject’s design based on the population parameters.
- Individual fits : Model estimation on the subject’s design and covariate based on the individual parameters. The individual parameters come from the conditional mode or the conditional mean estimation.
- BLQ data : show and put in a different color the data that are BLQ (Below the Limit of Quantification).
- Legend : add/remove the legend. There is only one legend for all the individual fits.
- Informations : add/remove the individual parameter estimation for each individual fit.
- Prediction distribution
- The median value obtained with the predicted distribution coming from the population parameter.
- The prediction interval (associated with a level): allows to see the variability driven by the inter-individual variability.
By default, only the observed data and the individual fit are proposed.