Purpose
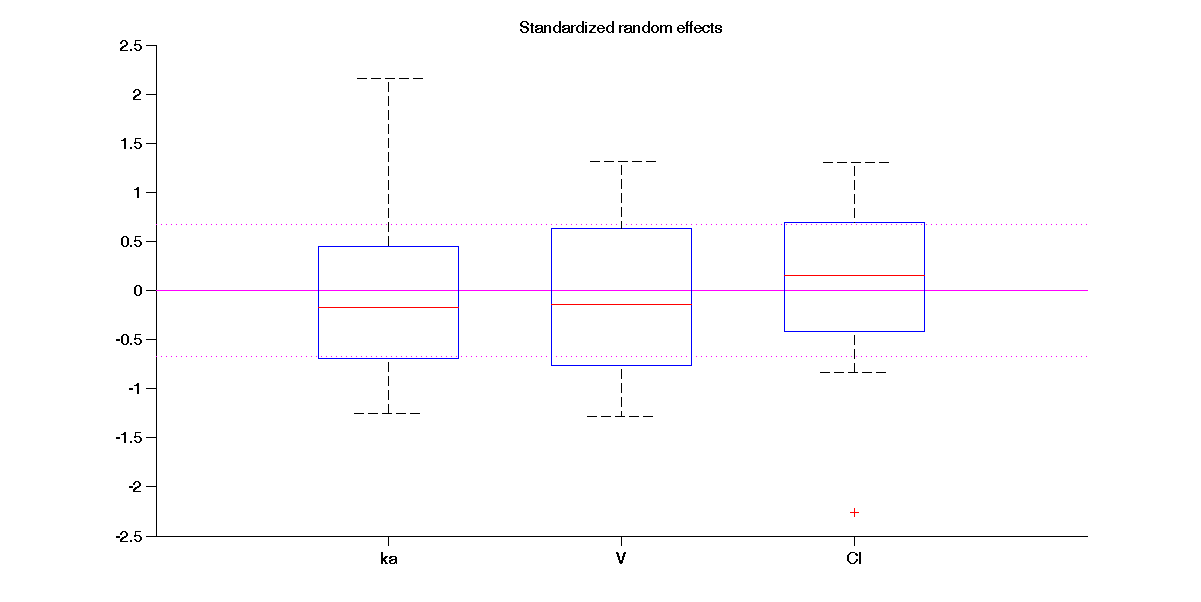
This graphic displays the distribution of the random effects with boxplots. The horizontal dotted lines show the interquartile interval of a standard Gaussian distribution.
Example of graphic
In the following example, the parameters of a one compartmental model with first order absorption and linear elimination (on the theophylline data set) are estimated. One can see for distribution of the random effects associated to each parameter.
Settings
- Display
- Theoretical median
- Theoretical quartiles
- Estimator. The user can define which estimator is used for the definition of the individual parameters and thus for the random effects.
By default, both displays are proposed with the individual parameters coming from the conditional mode estimation.