Purpose
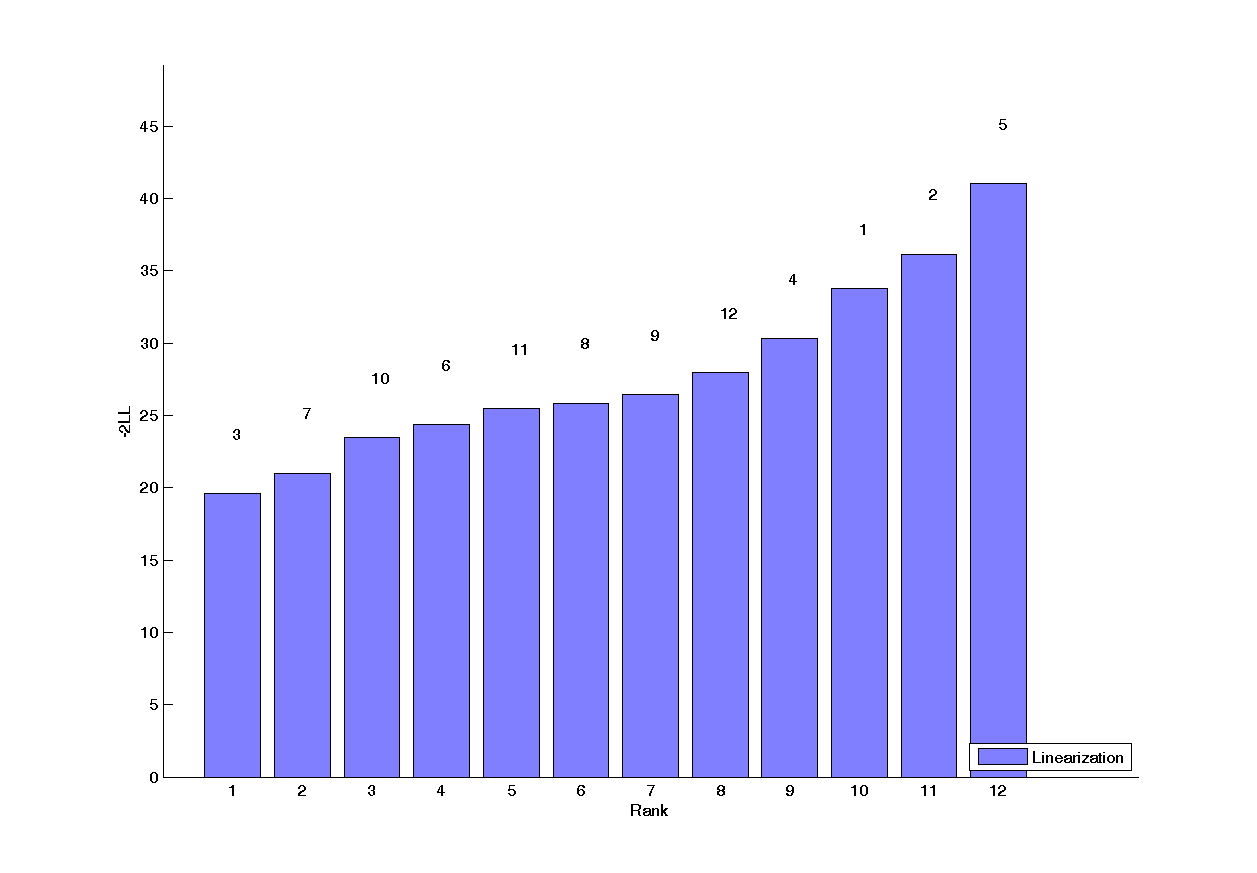
This graphic displays the contribution of each individual to the log-likelihood. This graphic is only available if the log-likelihood was previously computed.
Example of graphic
In the following example, the parameters of a one compartmental model with first order absorption and linear elimination (on the theophylline data set) are estimated. One can see the contribution of each subject.

Settings
- Label
- Index
- Name of the subject
- Legend