Purpose
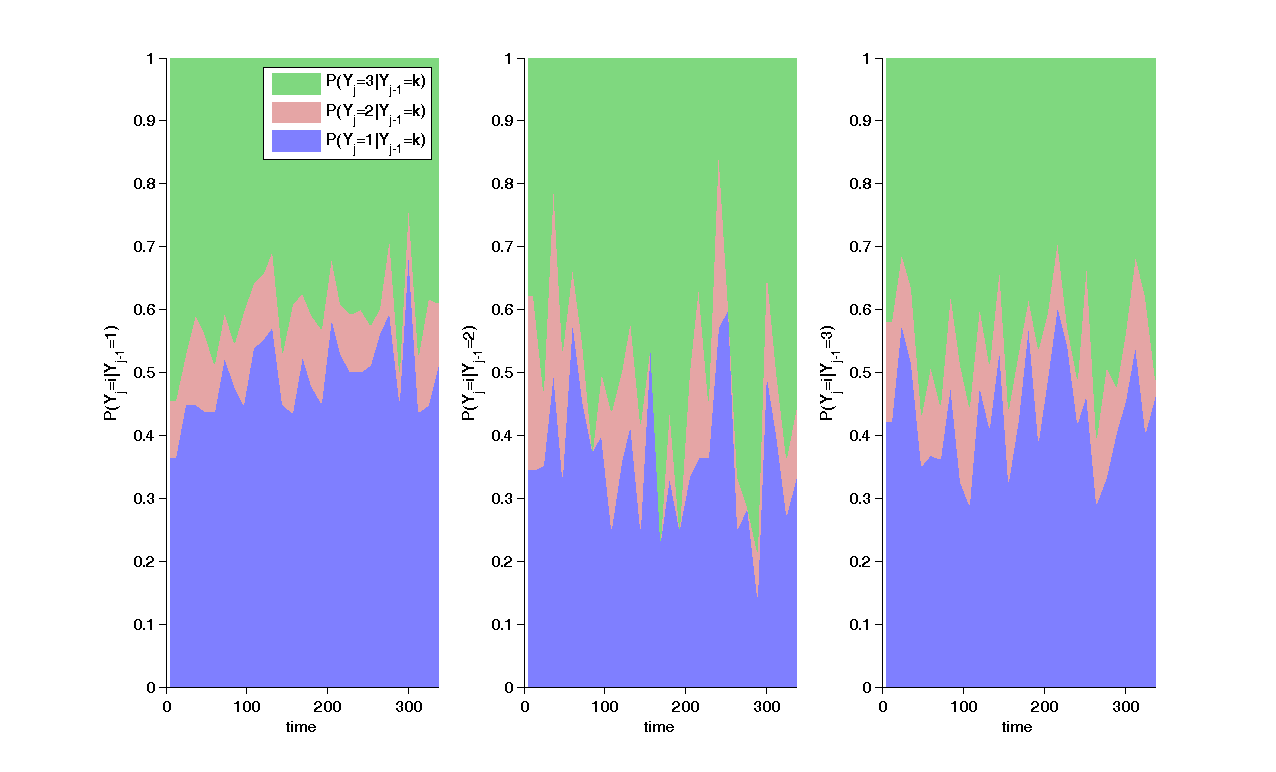
This graphic displays the proportion of each category knowing the previous one. It is only available for discrete observations and any discrete model.
Example of graphic
In the following example, the parameters of a three-categories markov model are estimated. The figure presents the proportion of each category knowing the previous one. Moreover, there are no dependency on the previous one, only on figure representing the modalities proportion is displayed. 
Settings
- Proportion
- Cumulated by modalities
- Separated
- Display
- Bins
- Legend