Purpose
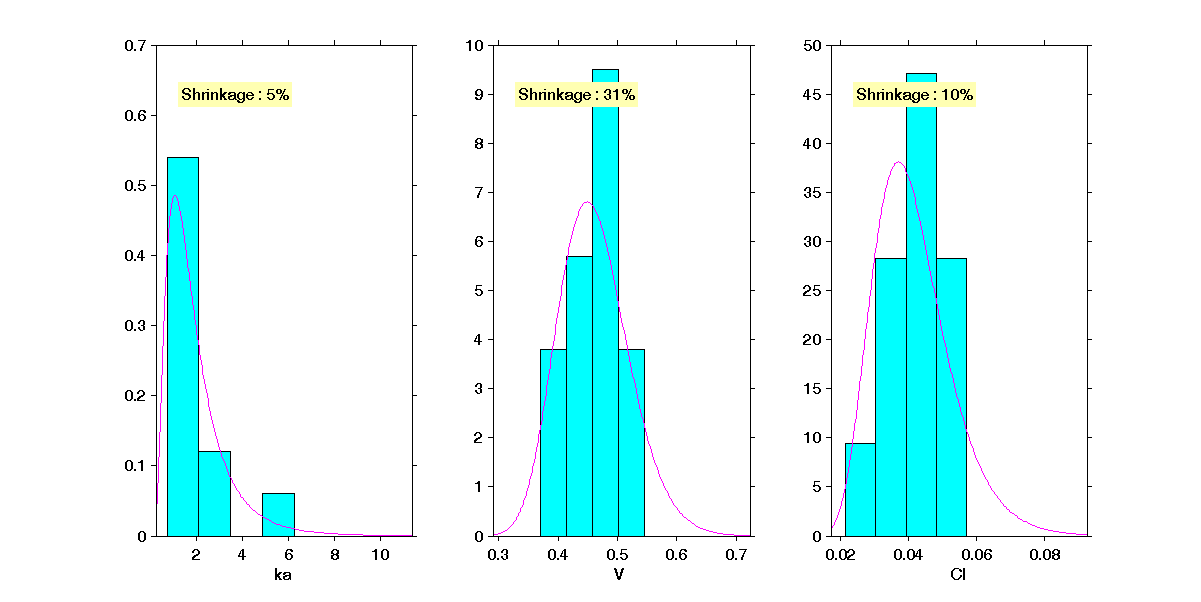
This figure displays the estimated population distributions of the individual parameters. Settings allow you to show a summary of the theoretical distributions (mean, median, mode, percentiles), histograms, and a non-parametric estimation of the distribution. It is also possible to display the empirical distribution of the individual parameters and the shrinkages computed as follows for each random effect:
Example of graphic
In the following example, the parameter distribution of a one compartmental model with first order absorption and linear elimination (on the theophylline data set) is proposed. One can see for each parameter (ka,V,Cl) the estimated law, the histogram of the realizations and the calculation of the shrinkage.

Settings
- Display
- Population distribution: parameter distribution given by the user with the estimated population parameter,
- Histogram: represents the histogram of the realization of the considered values,
- Non param. pdf: add/remove distribution estimated by the estimated realization of the random effects.
- Legend : add/remove the legend.
- Informations : add/remove the shrinkage in %
- Estimator. The user can define which estimator is used for the definition of the individual parameters.
By default, only the population distribution is proposed with the individual parameters coming from the conditional mode estimation.