Purpose
This figure displays observations (

Example of graphic
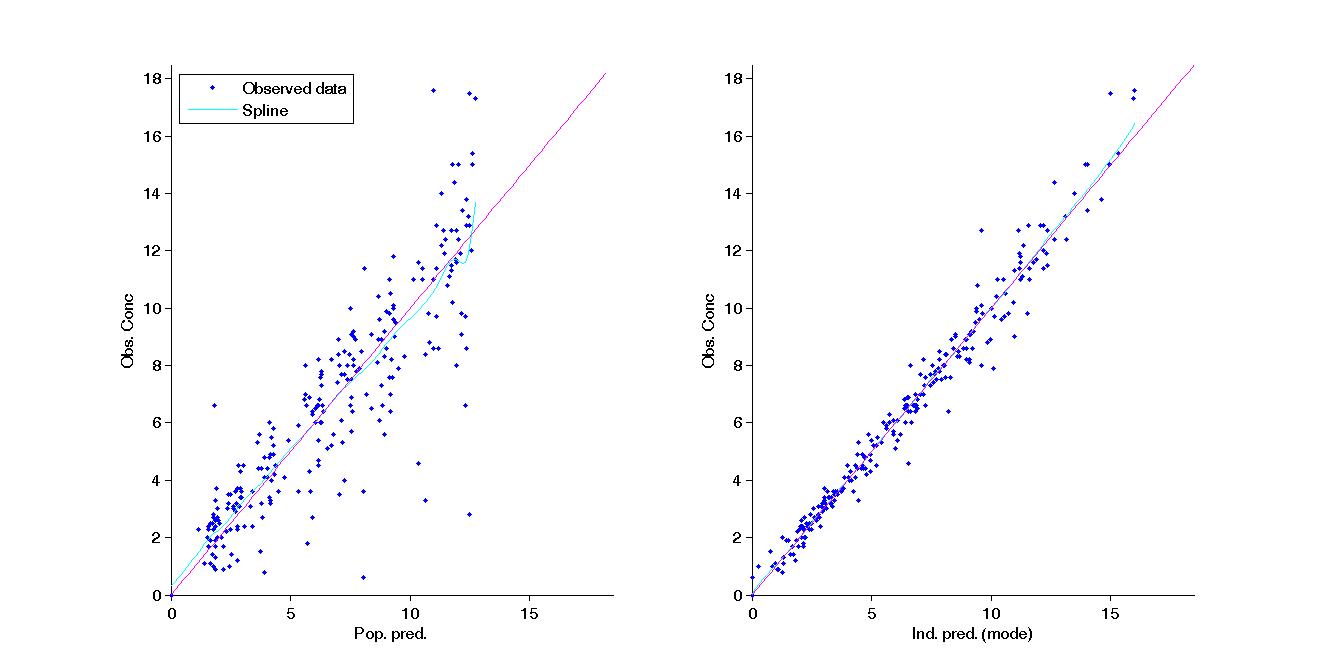
In the proposed example, the concentration for the warfarin example is presented. It is modeled by a one compartment first order absorption model with a linear elimination. On the left, the scatter plot of the observed concentration with respect to the predicted concentration using the estimated population parameters is displayed. On the right, the scatter plot of the observed concentration with respect to the predicted concentration using the individual parameters is displayed.
Settings
- Prediction
- Population prediction: add/remove the figure with the comparison between the population prediction and the observations.
- Individual prediction: add/remove the figure with the comparison between the individual prediction (based on the chosen conditional estimation) and the observations.
-
- Observed datas,
- Segments by individuals: Add/remove segments between the observation of each individual
- BLQ data : show and put in a different color the datas that are BLQ (Below the Limit of Quantification)
- Splie: add/remove a spline interpolation on the comparison between the prediction and the observation.
- Legend : add/remove the legend. There is only one legend for all the individual fits
By default, both population and individual prediction are proposed.