Purpose
The figure displays the estimators of the individual parameters in the Gaussian space, and those for random effects, (e.g. the conditional expectations ")
")
Example of graphic
In the proposed example, the parameters estimation for a PKPD model on the warfarin data set is presented. The random effects of 3 parameters of the PD model are displayed w.r.t. a transformed version of the weight (t_wt=log(wt/70)), the weight, and the sex category.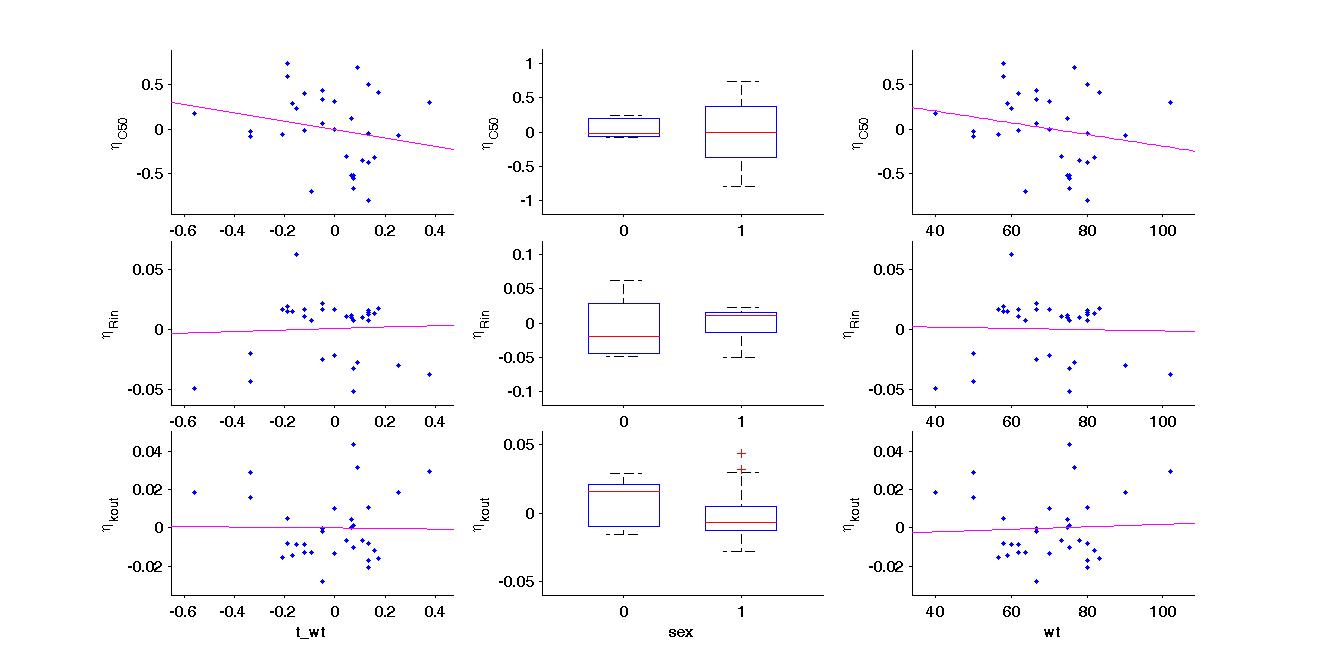
Settings
- Grid arrange. Define the number of individual parameters (or random effects) and covariate that are displayed. The user can define the number of rows and the number of columns.
- Display
- The user can choose to see either the individual parameters or the Random effects.
- Data
- Splines: add/remove the a spline interpolation
- Regression lines: add/remove the affine fit
- Baseline: add/remove the baseline.
- Informations : add/remove the correlation information for each continuous covariate and each random effect.
- Legend : add/remove the legend.
- Estimator. The user can define which estimator is used for the definition of the individual parameters.