Objectives: learn how to define outputs and create tables from the outputs of the model.
Projects: tgi1_project, tgi2_project
About the OUTPUT block
- tgi1_project (data = ‘tgi_data.txt’ , model=’tgi1_model.txt’)
We use the Tumor Growth Inhibition (TGI) model proposed by Ribba et al. in this example (Ribba, B., Kaloshi, G., Peyre, M., Ricard, D., Calvez, V., Tod, M., . & Ducray, F., A tumor growth inhibition model for low-grade glioma treated with chemotherapy or radiotherapy. Clinical Cancer Research, 18(18), 5071-5080, 2012.)
[LONGITUDINAL]
input = {K, KDE, KPQ, KQPP, LAMBDAP, GAMMA, DELTAQP,PT0,Q0}
PK:
depot(target=C)
EQUATION:
t0=0
PT_0=PT0
Q_0 = Q0
PSTAR = PT+Q+QP
ddt_C = -KDE*C
ddt_PT = LAMBDAP*PT*(1-PSTAR/K) + KQPP*QP - KPQ*PT - GAMMA*KDE*PT*C
ddt_Q = KPQ*PT - GAMMA*KDE*Q*C
ddt_QP = GAMMA*KDE*Q*C - KQPP*QP - DELTAQP*QP
PSTAR is the tumor size predicted by the model. It is therefore used as a prediction for the observations in the project:
[LONGITUDINAL]
input = b
file = 'model/tgi1_model.txt'
DEFINITION:
y1 = {distribution=normal, prediction=PSTAR, errorModel=proportional(b)}
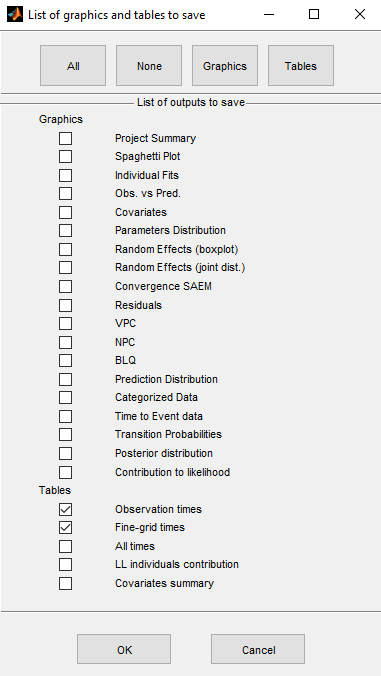
We can select which tables and graphics to save with the button Outputs to save

We select in this example the tables with predicted values computed at the observation times and on a finer grid (used for the graphics of individual fits)
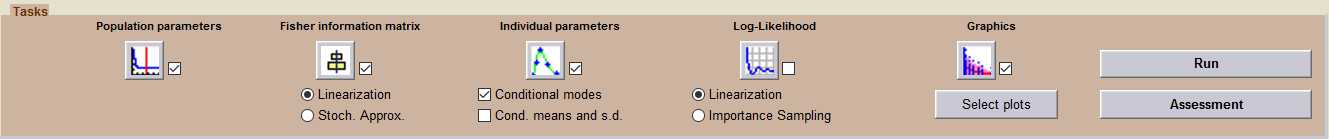
The sequence of tasks selected in this project includes the estimation of the individual parameters (using the conditional models) and several diagnostic plots (including the individual fits).
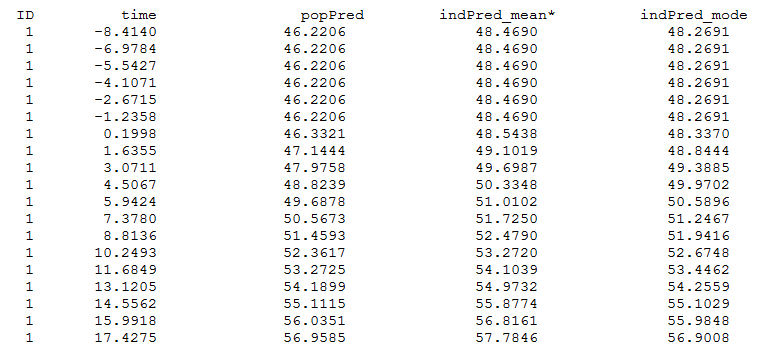
Thus, individual predictions of the tumor size PSTAR are computed using both the conditional modes (indPred_mode) and the conditional means estimated during the last iterations of SAEM (indPred_mean*) and saved in table predictions.txt
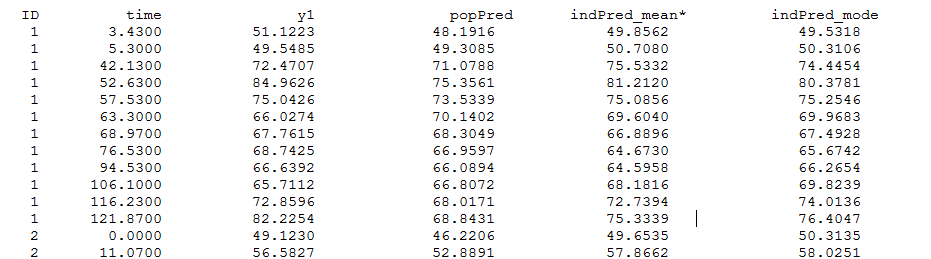
and finegrid.txt
Remark: the same model file tgi1_model.txt can be used with different tools, including Mlxplore or Simulx (see this Shiny application for instance).
Add additional outputs in tables
- tgi2_project (data = ‘tgi_data.txt’ , model=’tgi2_model.txt’)
We can save in the tables additional variables defined in the model, such as PT, Q and QP, for instance, by adding a block OUTPUT: in the model file:
OUTPUT:
output = PSTAR
table   = {PT, Q, QP}
Tables predictions.txt and finegrid.txt now include the predicted values of these variables for each individual (columns PT_mean*, Q_mean*, QP_mean*, PT_mode, Q_mode, QP_mode, PT_pop, Q_pop, QP_pop).