Purpose
The principle of the VPC (Visual Predictive Check) is to assess graphically whether simulations from a model of interest are able to reproduce both the central trend and variability in the observed data, when plotted versus an independent variable (typically time). A VPC is based on multiple simulations with the model of interest and the design structure of the observed data (i.e., dosing, timing, and number of samples). Percentiles of the simulated data are compared to the corresponding percentiles of the observed data. The percentiles are calculated either for each unique value of the independent (x-axis) variable or for a bin across the independent variable. It allows us to summarize in the same graphic the structural and statistical models by computing several quantiles of the empirical distribution of the data after having regrouped them into bins over successive intervals.
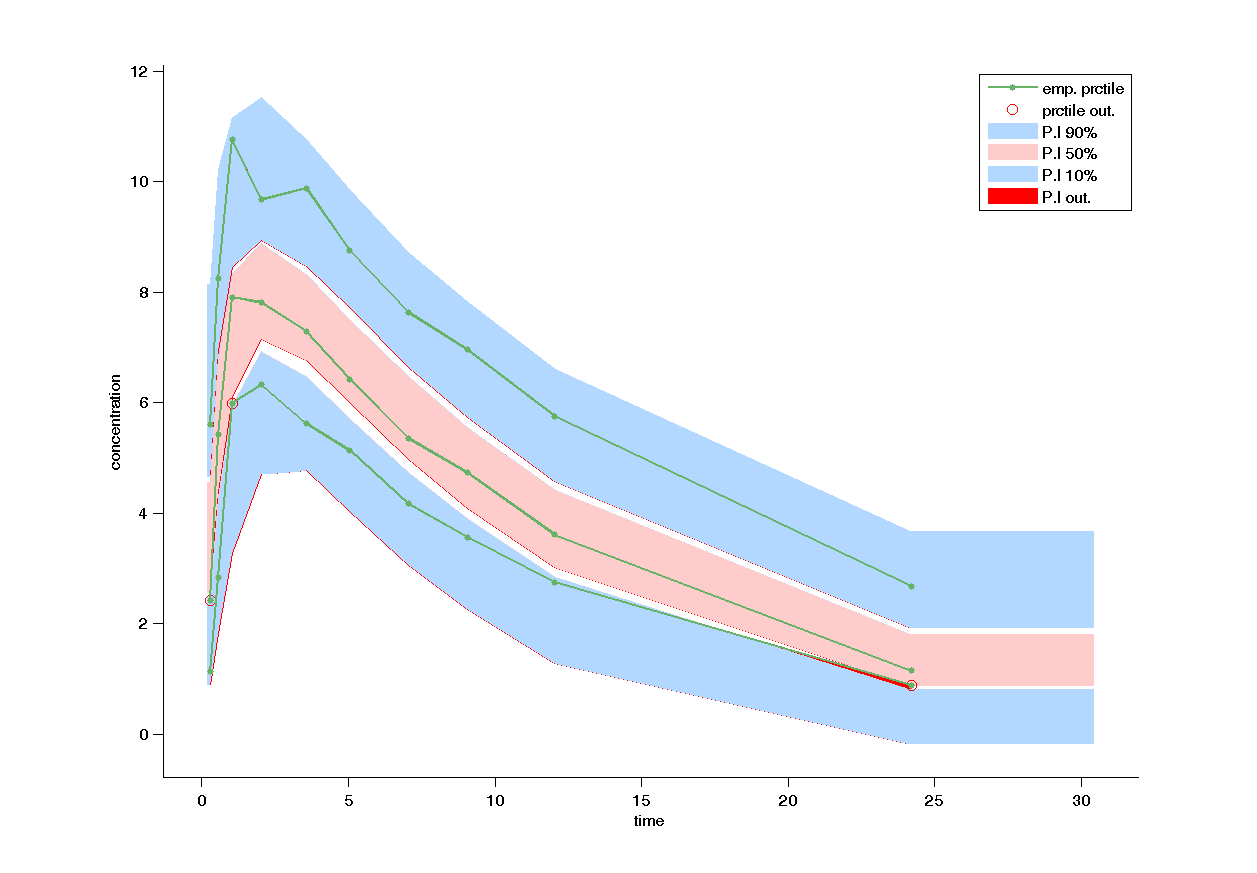
By default, the median and 10th and 90th percentiles are presented. The interpercentile range between the outer percentiles of all the simulated data, i.e. the prediction interval, is displayed with a level of 90%.
Example of graphic
In the following example, the parameters of a one compartmental model with first order absorption and linear elimination (on the theophylline data set) are estimated. The figure presents the VPC with the prediction interval for quantile 10%, 50% and 90%. Additionally,
Settings
- Display:
- Observed data
- BLQ data (with a possibility to color them specifically)
- Empirical percentile
- Theoretical percentile
- Prediction interval
- Outliers (in dots or in area)
- Bins
- pcVPC using Uppsala prediction correction
- Legend